
When we talk about India Economy before and after Modi in India’s economic story than it is is often debated through one headline number called as GDP growth. Few knows what it means but everyone wants to know what the number and ranking is.
But if you zoom out, the bigger picture is about stability vs volatility, inflation control vs price shocks, investment capacity vs fiscal stress, and how India positioned itself through global hits like COVID and supply-chain disruption.
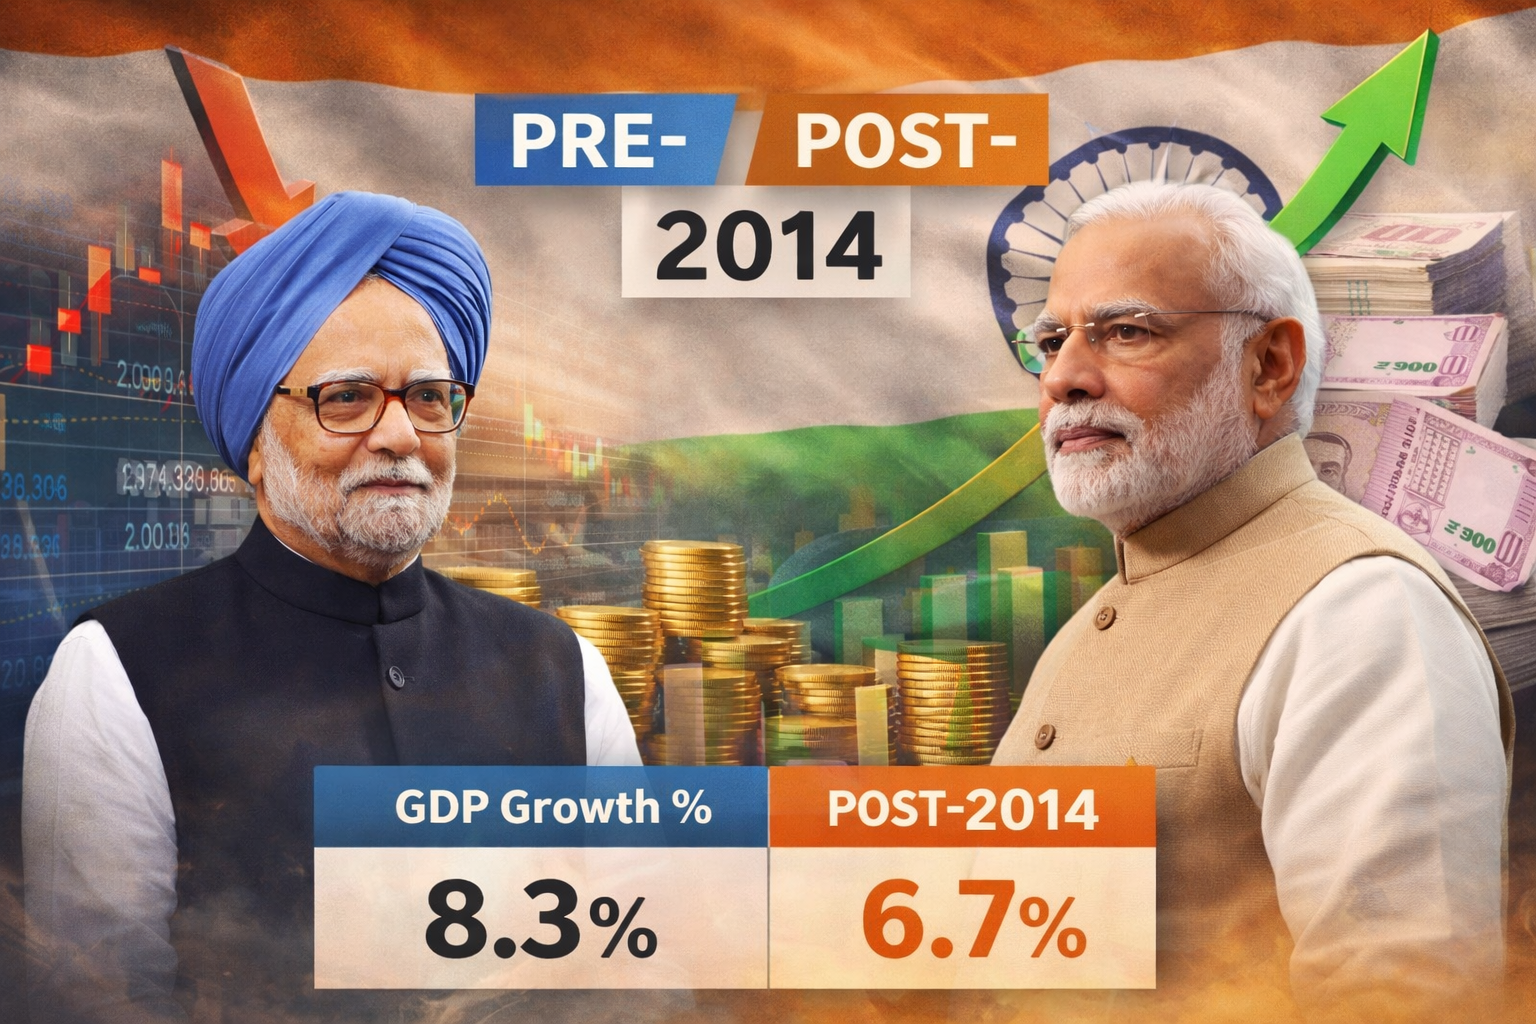
This article compares the pre-2014 decade, largely UPA years, with the post-2014 decade, largely NDA/Modi years, using widely cited indicators like nominal GDP, inflation direction, forex buffers, employment scale, and market depth. The aim is simple and that is a clean, readable, data-based view of the India economy before and after Modi.

1) The Pre-2014 Economy: High Growth, Higher Fragility
Between 2004 and 2011 especially, India posted several years of strong growth. The period benefited from a supportive global cycle and domestic expansion. But toward the later part of the decade, the economy began to face visible stress, especially around inflation, deficits, and confidence.
A key feature of this period was that growth was often accompanied by high and sticky inflation, which hits households directly like food, fuel, rent, daily essentials. High inflation can also raise interest rates and reduce long-term investment appetite.
What defined the pre-2014 mood?
- Fast growth phases early in the decade, followed by slowdown later.
- High inflation episodes, which squeezed real incomes.
- Concerns around policy delays and fiscal pressures during the slowdown years.
2) The Post-2014 Economy: Lower Average Growth, Bigger Scale
Post-2014, India’s growth path includes major disruptions like policy transitions for e.g. GST, global shocks, and a once-in-a-century pandemic. As a result, average real growth comparisons become tricky because the base years and shocks differ.
But even with those shocks, India’s economic scale expanded sharply.
A major headline that’s hard to ignore that India’s nominal GDP at current prices rose from about ₹106.57 lakh crore (2014–15) to an estimated ₹331.03 lakh crore (2024–25), according to a Government of India PIB note.
That scale expansion matters because it affects:
- the government’s capacity to allocate funds for infrastructure and social welfare,
- the private sector’s ability to invest,
- and India’s weight in global supply chains and capital flows.
3) Quick Comparison Table: What Changed Across the Two Eras
| Indicator | Broad Pre-2014 Pattern | Broad Post-2014 Pattern |
|---|---|---|
| Growth | Strong peaks earlier, slowdown later | More shock-heavy decade, steadier rebound after disruptions |
| Inflation pressure | Higher and more persistent inflation periods | More emphasis on inflation management, inflation still spikes during global shocks |
| Economic scale | Smaller base economy | Much larger nominal GDP scale (₹106.57L cr → ₹331.03L cr) |
| External buffer | Lower forex cushion | Forex reserves crossed $700B milestone in 2024 (reported widely) |
| Employment measurement | Smaller comparable headline level | Employment cited at 64.33 crore for 2023–24 (official releases/minister statements) |
| Markets & participation | Robust market performance yet diminished retail penetration | Deeper retail participation era (demat boom narrative widely discussed; varies by source) |
4) Inflation: The Most “Real-Life” Indicator
GDP can feel abstract. Inflation doesn’t. It shows up in kitchen budgets and EMI stress.
India’s inflation has moved in waves across both eras, rising when global commodities spike and easing when supply conditions normalize. Official inflation releases from MoSPI document where inflation stands in a given period. for example, CPI releases for late 2024 show inflation levels month by month.
What matters for readers:
- Pre-2014 is often remembered for more frequent high-inflation stretches.
- Post-2014 saw a policy push toward inflation management, though global shocks (like pandemic-era disruptions) still created inflation pressure.
5) Jobs: The Loudest Debate, The Messiest Measurement
Employment is where political arguments get the hottest because job quality, wages, and youth opportunities matter more than any macro chart.
Recent official/public statements cite employment at 64.33 crore in 2023–24, up from the mid-2010s baseline, framing the post-2014 period as one of large net additions.
But here’s the nuance smart readers care about:
- Job quantity and job quality are not the same.
- A rise in employment can still coexist with concerns about wages, informality, and youth job matching.
- Different datasets like PLFS, EPFO, CMIE, KLEMS may tell different parts of the story depending on definitions.
So the most honest take is, employment scale has expanded, while debates continue around quality and distribution.
6) Investment & Resilience: Foreign Exchange Reserves as a Buffer
One clean “confidence” indicator is forex reserves. When reserves rise, it signals stronger external buffers which are useful during crises like oil spikes, capital outflows and currency pressure.
India crossed a major psychological milestone when forex reserves topped $700 billion in 2024, reported by Reuters and echoed by official write-ups.
In 2025, Reuters also reported reserves around $676.3 billion in early April 2025 (showing how reserves move with valuation and intervention).
This matters because it supports:
- import cover and currency stability,
- confidence for investors,
- and policy room during global turmoil.
7) India Economy Before and After Modi : What the Data Suggests
If you judge the India economy before and after Modi only by average GDP growth, you’ll miss the structural story.
The pre-2014 period had phases of impressive growth, but also ended with visible stress signals, especially inflation and confidence issues.
The post-2014 period includes disruptive transitions and a massive pandemic shock, yet also shows a larger economic scale, stronger external buffers, and a big push toward investment-led capacity building.
The most accurate summary is as follows.
India’s economy appears to have shifted from a high-growth-but-high-friction model to a larger, more shock-tested, investment-capacity-driven model while still facing the core challenge that matters most to citizens, better jobs and better incomes at scale.
A lawyer and legal researcher committed to serving the nation through law, policy awareness, and public-interest legal writing. With a strong focus on taxation, property law, and regulatory compliance, he works to simplify complex legal issues for citizens, professionals, and investors while promoting informed decision-making and responsible development. His writing reflects a dedication to strengthening legal awareness, national growth, and the betterment of India through research-driven analysis and practical legal insights.